Wind energy is one of the most promising renewable energy sources in the world. To efficiently harvest the wind kinetic energy, modern wind turbines are designed to have large sizes and flexible structures. Such system characteristics, however, also create a major challenge for long-term durability of wind turbines. A new adaptive control strategy is formulated for the pitch control of wind turbine that may suffer from reduced life owing to extreme loads and fatigue when operated under high wind speed and internal structural uncertainties.
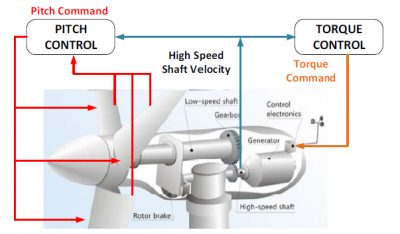
Figure 1 Wind turbine pitch and torque controls
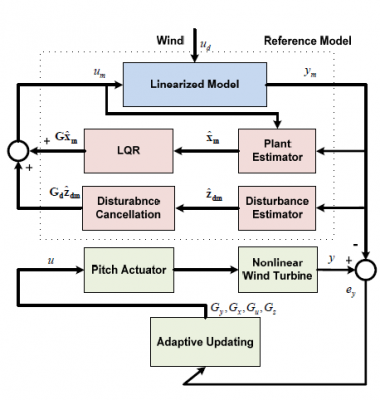
There are three separate control loops in wind turbine system: pitch control, torque control and yaw control. The first two control loops are shown in Figure 1. Specifically, we aim at making a trade-off between the maximum energy captured and the load induced. The adaptive controller is designed to both regulate generator speed and mitigate component loads under turbulent wind field when blade stiffness uncertainties exist. The proposed algorithm is tested on the NREL offshore 5-MW benchmark wind turbine. The block diagram of adaptive control is shown in Figure 2.

Figure 2. Adaptive control

Figure 3. Time-domain performance comparison of GSPI, DAC, and adaptive control under 15 m/s turbulent field. (a) Wind speed; (b) Generator speed; and (c) Flapwise root moment.
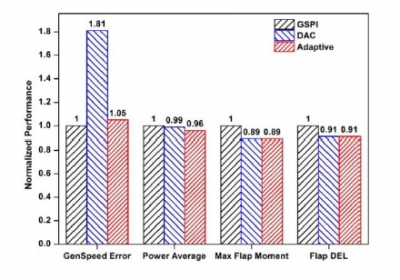
The adaptive control performance is compared with those of the gain scheduled proportional integral (GSPI) control and the disturbance accommodating control (DAC) that are used as baselines. The adaptive controller reduces the flapwise moment DEL by 9% which is similar to DAC controller. The normalized generator speed errors of GSPI, DAC and adaptive control are 0.1693, 0.2960, and 0.1727, respectively. The DAC controller exhibits a much larger error than the adaptive controller. The average power output of the adaptive controller is slightly less than those of GSPI and DAC. The extreme flapwise moment is decreased about 11% in DAC and adaptive control. The overall performances are compared in Figure 4, where all performance indices are normalized with respect to those obtained based on GSPI.
Figure 4. Performances comparison of three controllers.