At DSCL, we work extensively on uncertainty propagation analysis. We integrate together finite element forward and inverse analyses, order-reduced modeling, Bayesian inference, and Gaussian processes etc, aiming at predicting response variation and guiding design modification efficiently and accurately. Examples of our progress include:
- predicting dynamic response variation using Gaussian process emulation;
- probabilistic finite element model updating using intelligent inference with incomplete modal information;
- reducing forced response variation in cyclically periodic structure using design optimization based on nested Gaussian processes;
- geometry perturbation towards reduction of dynamic response variation based on NURBS (non-uniform rational B-splines) finite element.
One recent advancement that we have achieved is uncertainty quantification in structural dynamic analysis using two-level Gaussian processes and Bayesian inference. The underlying idea is to employ the two-level Gaussian processes emulator to integrate together small amount of high-fidelity data from full-scale finite element analysis and large amount of low-fidelity data from order-reduced analysis to improve the response variation prediction. As component mode synthesis (CMS) is adopted in order-reduced modeling, we then utilize the improved response variation prediction on modal characteristics to update the CMS model to facilitate the efficient probabilistic analysis of any responses of concern.
The analysis framework is illustrated in the figure below.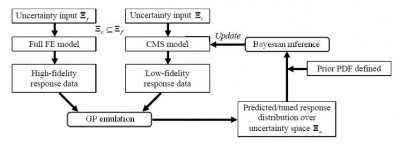
A benchmark example structure is analyzed for demonstration. The original structure has 3,600 DOFs, and the corresponding order-reduced CMS model (built upon 3 substructures) has 8 DOFs. Uncertainty is introduced into the analysis as material property variation. Mode Assurance Criterion (MAC) is adopted to quantify mode shape variation. We compare the baseline results (full-scale Monte Carlo analysis on full-scale finite element model) with those obtained from order-reduced model directly and from order-reduced model with updating (i.e., the two-level Gaussian processes). We employ the Mahalanobis distance (MD) to measure the distribution discrepancy. In general, the smaller the Mahalanobis distance is, the closer the two distributions are. Summarized in the table below are Mahalanobis distances comparison. The two-level Gaussian processes approach shows considerable performance improvement in predicting modal response variations.
Mahalanobis distances of modal response distributions between original and updated order-reduced models with respect to full-scale model
| Natural frequency | MAC | |||
| original | updated | Original | updated | |
| 1 | 0.2158 | 0.1933 | 139.6418 | 130.8213 |
| 2 | 0.1665 | 0.2182 | 22.6953 | 17.1507 |
| 3 | 0.6523 | 0.6302 | 68.5197 | 53.3759 |